Web Interface
The ForO web consists of a main drop-down menu which gives access to PWV and turbulence forecasts by observatory (ORM and OT).
ForO PWV Web Interface
This system currently generates two final products:1. PWV forecasts time series: 2 independent time series, for ORM and OT obtained from the highest resolution domain (d03).
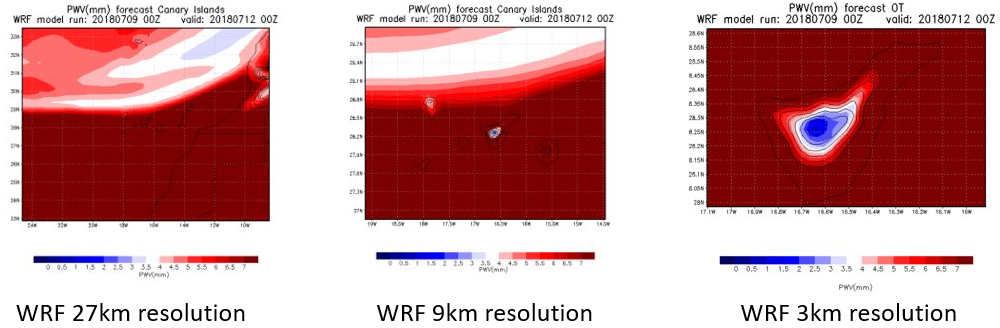
2. PWV forecast 2D charts: for the desired domains (d01 (9km), d02 (3km), d03 (1km)), centered at each observatory (ORM and OT).
While product 1 (PWV time series) show the predicted PWV above the specific observatory, product 2 (PWV color plots) provide a 2D view of the PWV structure above the observatory height at synoptic scale for 3 different model domains at horizontal resolutions of 9, 3 and 1 kilometers, as shown in the following examples:
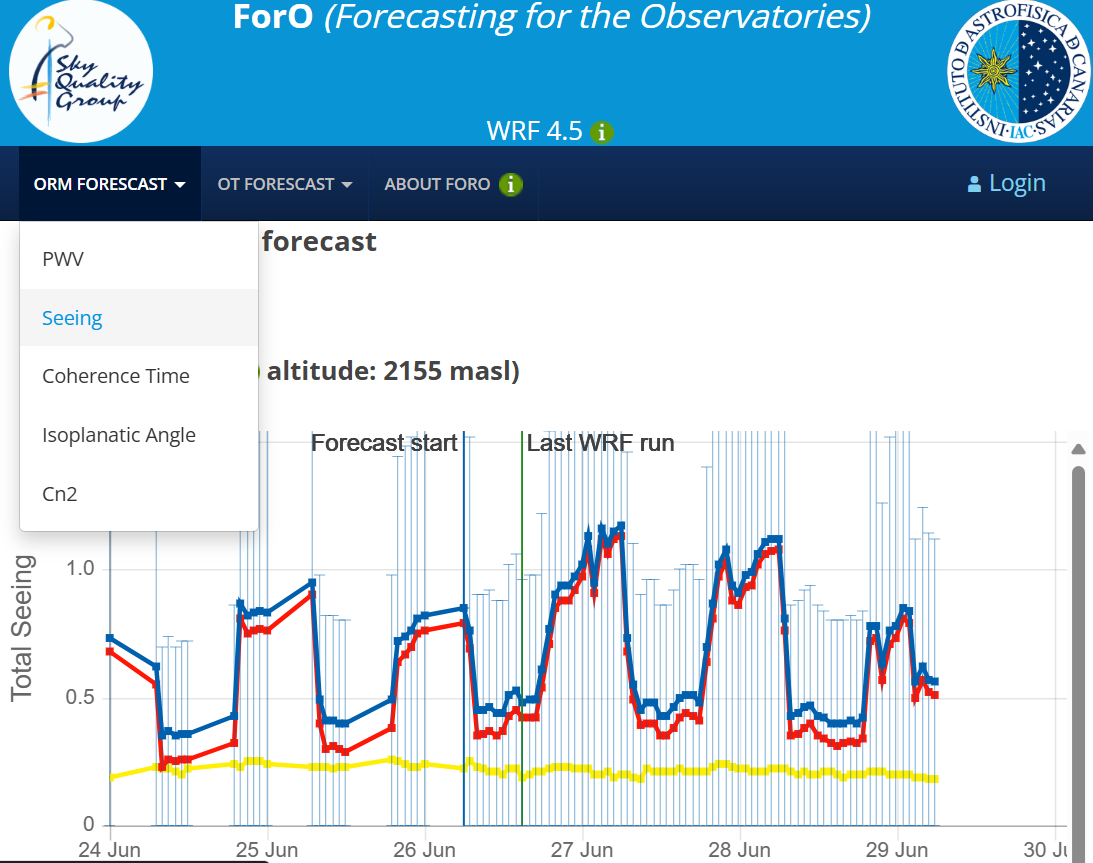
ForO Seeing Web Interface
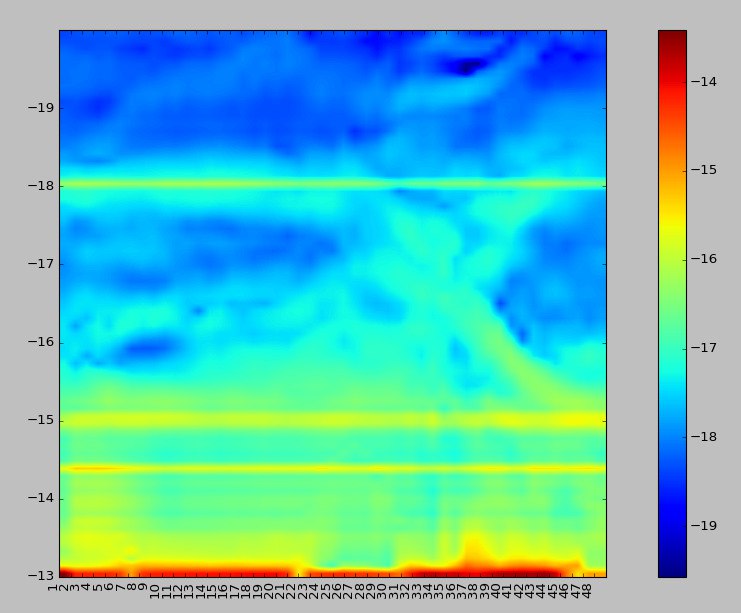
This system currently generates two final products:1.Forecasted optical coherence parameters time series:independent time series for ORM and OT, obtained from the highest resolution domain (d03), for the following parameters: total seeing, Boundary Layer (BL) seeing, Free Atmosphere (FA) seeing, coherence time and isoplanatic angle. 2.PWV forecast 2D charts:it shows the evolution of the different turbulence layers above each observatory in the next 48 hours, with a temporal resolution of 1 hour. This plot is shown in the website above the seeing time series, thus allowing to relate the evolution of the seeing with changes in the turbulent layers above the observatory. The next image is an example of the Cn2 cross-section:
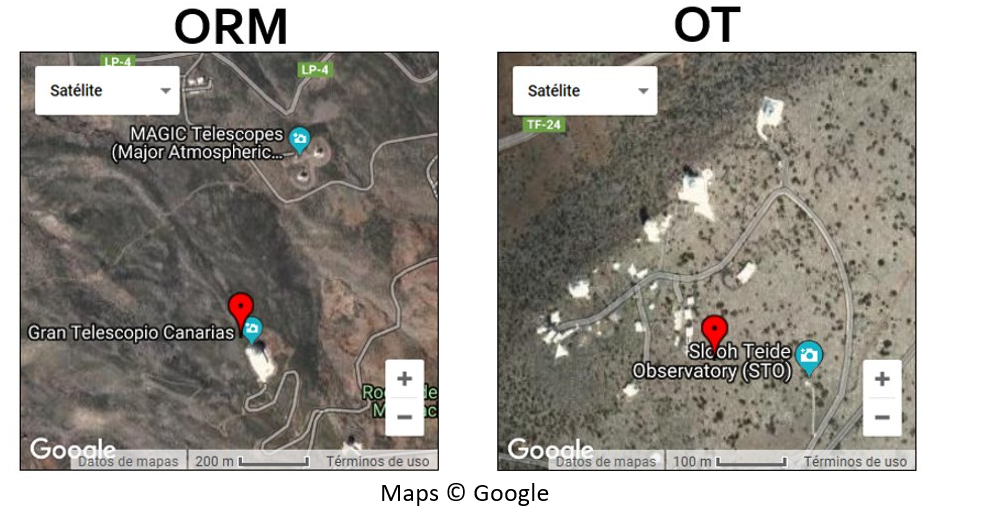
The WRF model is centered above each observatory coordinales, which are:
For Observatorio del Roque de los Muchachos (ORM): 28.76° Latitude -17.88° Longitude
For Observatorio del Teide (OT): 28.30° Latitude -16.51° Longitude
The different forecasting products are further described in specific tutorials accessible through the
 icon in the text above each product.
For the case of PWV forecasts, the raw output of the WRF model is automatically adjusted following the calibration described in Pérez-Jordán et al (2015) and Castro-Almazán et al (2016), using high resolution radiosoundings. The PWV time series include the Total Forecast Error as described in full detail in Pérez-Jordán et al (2018). The detailed configuration of the WRF model implemented in ForO can also be found in this later publication.
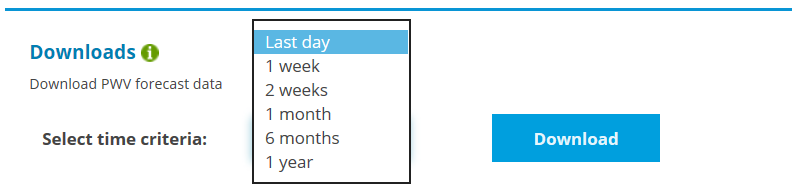
Besides display of forecasted PWV and optical turbulence above the observatories, the web interface allows the user to check the state of the current WRF run (if the model is running in that moment) or know the next scheduled time for WRF model run. Finally, a Download sections allows the user to get PWV historical data from the system in ASCII format up to 6 months (different options available in the drop-down menu):
All the previously described sections are further explained in specific tutorials. Finally, it is worth noting that the ForO system arquitecture allows to add new meteorological parameters for forecasting in future phases, without impacting system arquitecture.
