
PWV forecast Time Series plot and statistics
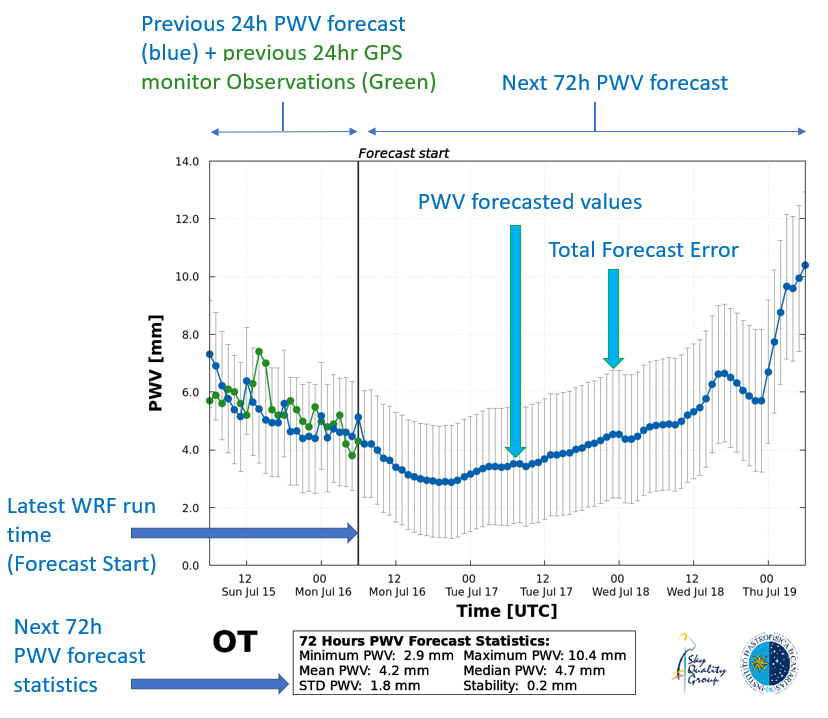
The PWV forecasted time series show the predicted evolution of the PWV (y-axis, in mm) over time (x-axis, date and time UTC). The plot is divided by a vertical line, which indicates de latest WRF model run time (also marked in the plot with the label "Forecast Start", into two parts:
- To the left of the line is the latest 2 runs as predicted by the WRF model in
the latest 4 runs (shown in blue color). This "past forecast" can be used to make a verification
of the forecasts with PWV observational data (for example, from the PWV monitor based on GPS in
operation at ORM) or based on the infrared instrument performance used last night (for example:
from the registered instrument sensitivities). In this sense, we have included also the latest
PWV observations by the Water Vapour monitor based on GPS in operation at both ORM and OT
(shown in green color).
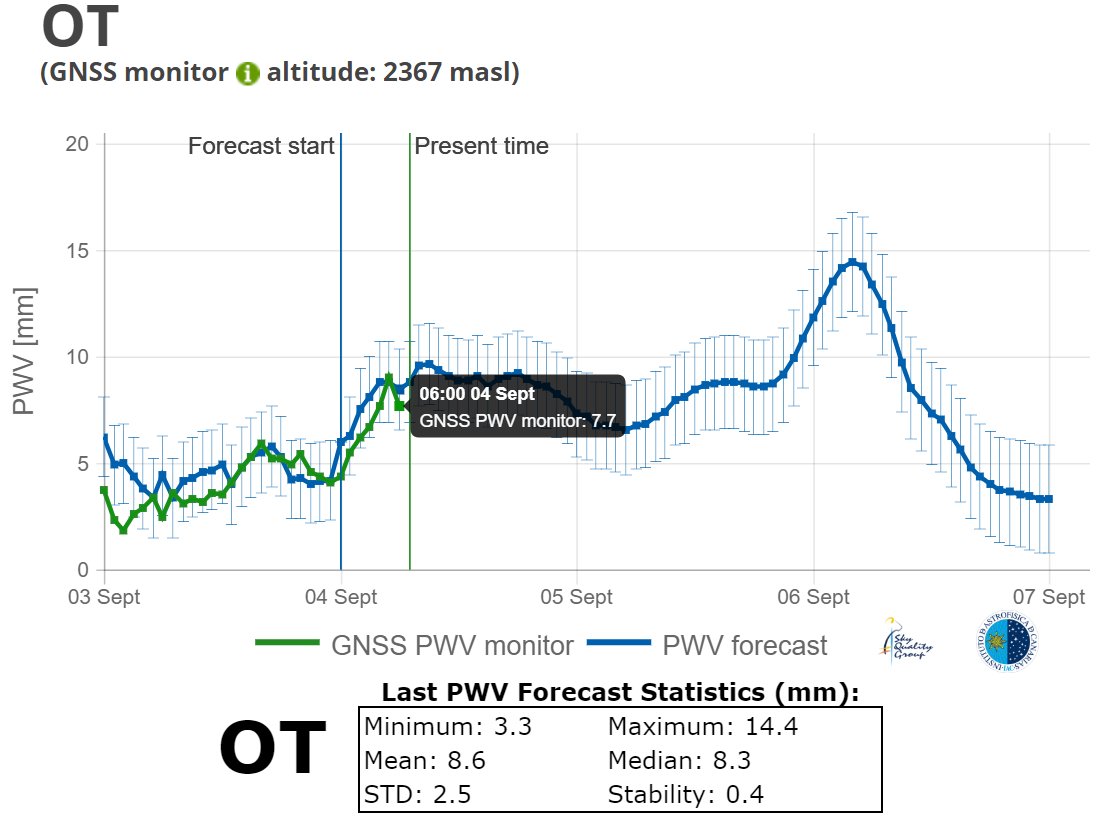
- To the right of the vertical line is the next 3 day (72 hours) forecast of PWV above the observatory. An additional vertical line in green color shows the "Present time", which is automatically set every time the user access this plot. It helps the user to locate the present moment and its PWV forecasted value.
This is a hourly time series, so a total of 96 data points are shown. Together with predicted values for the PWV, also an error bar is displayed. This error bar reflects the Total Forecast Error and it is computed following Pérez-Jordán et al (2018). This total error takes into account the degradation of the forecasts for longer forecast horizons and the instrumental uncertainties of the sensors used in the WRF model calibration.
The superposed observed PWV time series from the GPS monitor is expected to be used as a qualitative aid for the user to assess whether the forecasted PWV from the model agrees with observations. It should be noted, however, that the GPS water vapour monitor has its own uncertainties (usually in the range 0.5 – 1mm PWV) and that the plotted values correspond to the ones available in real-time, which are a first estimation based on fixed GPS satellite orbits (known as the "rapid" value). This value is 48 hours later more accurately determined by the GPS monitor but it is not reflected in this plot.
An example of the time series plot is shown below:
The time series plot allows user interaction by moving the mouse over any of the two time series plotted, the PWV forecast or the GNSS monitor PWV measurements, to easily read the PWV value and better compare the forecasted and measured PWV. The next figure shows an example of this functionality:
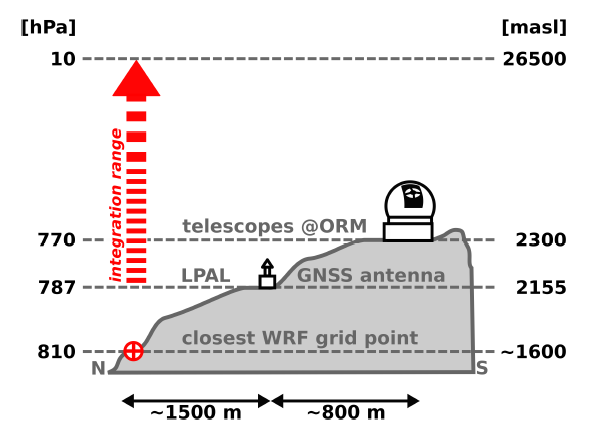
To compute the PWV, we integrate the water vapour mixing ratio in the vertical above the observatory (i.e: for Airmass=1) from the level corresponding to the long-term average atmospheric pressure and taking the closest model grid point at 1km horizontal resolution , as shown in the next figure, which is an example for the ORM:
To give a final value for the PWV forecasted value, specific calibrations for each observatory are applied following Pérez-Jordán et al (2015) and Castro-Almazán et al (2016). These calibration have been derived for the 3km horizontal resolution domain after a validation with high resolution radiosonde balloons at ORM and OT. As the main goal of the ForO system is to help astronomers to schedule infrared observations taking the most of the instruments working at those wavelengths, we also include a set of useful statistics of the 72-hr PWV forecasted in a box just below the time series plot. This statistics include: the minimum and maximum PWV, the mean, median PWV, standard deviation and PWV Stability expected in the next 72 hours. The last two parameters are provided to give an idea of the fluctuation of the PWV signal. As noted in García-Lorenzo et al (2010), the temporal fluctuations of PWV drastically affect the schedule of an observing night at a telescope/observatory working in queue mode. Knowledge of the temporal stability of PWV is also critical in polarimetric observations, which require that the conditions are as stable as possible during the whole observing sequence.
To compute the Stability we used the Absolute Differences method described in García-Lorenzo et al (2010), for Δt of 1 hour:
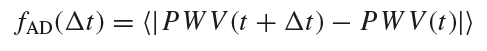
As a practical rule, low values of the stability are preferred with values ≤0.1mm indicating a very stable PWV signal.
Optical coherence parameters time series plots and statistics
The optical coherence parameters are derived from the structure function of the refractive index (Cn2) in the vertical above each observatory (Airmass=1) as this is a measure of turbulence strength impacting astronomical observations at visible wavelengths. They are computed using a combination of the raw output of the WRF model plus a statistical model based on observational data and developed by Vernin and Trinquet (V-T model hereafter). The optical coherence forecasted parameters time series show the predicted evolution of the (y-axis, in arcseconds) over time (x-axis, date and time UTC). The plot is divided by a vertical line, which indicates de latest WRF model run time (also marked in the plot with the label “Forecast Start”), into two parts:
- To the left of the line is the latest 24 hours forecast of the specific coherence parameter as predicted by the WRF model
in the latest 2 runs (shown in blue color). This “past forecast” can be used to make a verification of the Seeing forecasts with
Seeing observational data (for example, from the DIMM monitors in operation at ORM and OT). In this sense, we have included in
the plot, if available, the latest DIMM observations (shown in green color).
- To the right of the vertical line is the next 3-day (72 hours) forecast of PWV or forecasts of turbulence above the observatory.
An additional vertical line in green color shows the “Present time”, which is automatically set every time the user access this plot. It helps the user to locate the present moment and its forecasted value. These parameters time series are divided into: Seeing, coherence time and isoplanatic angle.
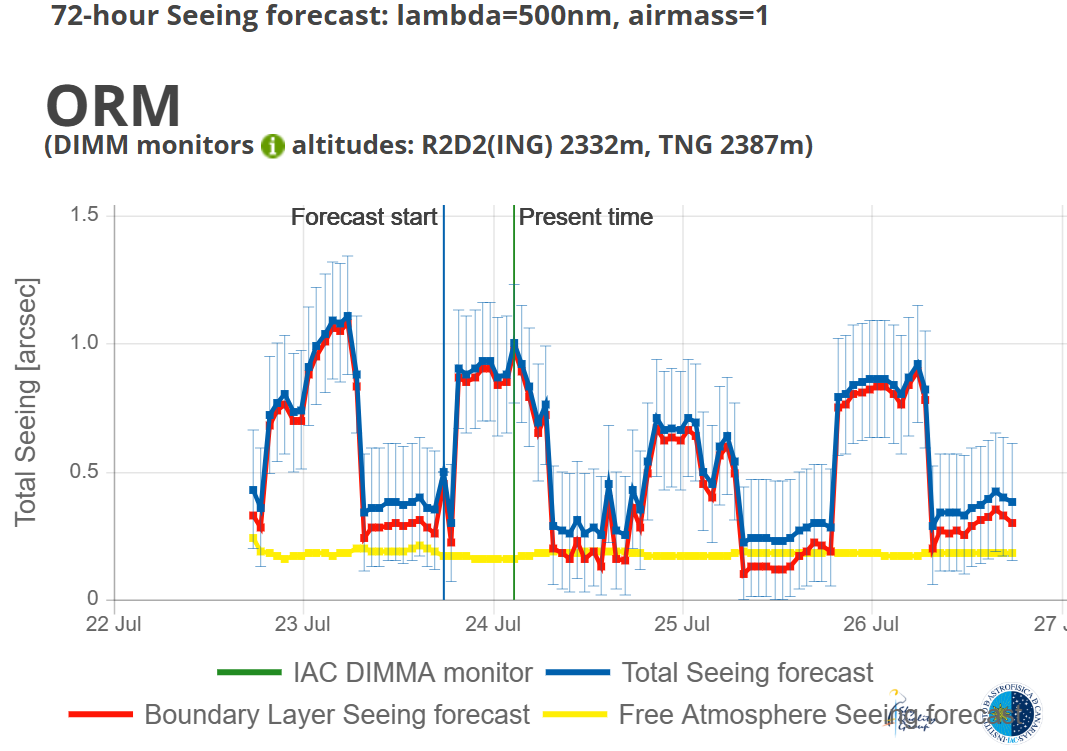
Seeing time series plots and statistics
Arguably, the most important measurement of turbulence impacting astronomical observations is given by the Seeing parameter measured in arcseconds (‘’). Additionally, a subdivision of the total seeing (computed integrating the Cn2 function in the atmospheric column above the observatory) is commonly used separating the Boundary Layer or BL Seeing (in our case following the usual definition of the first kilometers above surface) seeing and the Free Atmosphere or FA seeing (from the top of the Boundary Layer up to the highest model level around 66 hPa or 19 km). In ForO we give the 72-hour forecast of these 3 parameters (the Total, BL and FA seeing) in arcseconds computed for a wavelength centered in the visible (500nm) and in the vertical of the observatories (Airmasss=1). As in the case of the PWV forecasts, we plot the previous 24-hour forecast adding the DIMM seeing observations if available to be used as a qualitative aid for the user to assess whether the forecasted Total Seeing from the model agrees with observations. In the current version of the ForO system, an error bar is added in the plot as well computed from the RMSE obtained in a preliminary validation of the forecasts against G-SCIDAR observations (Castro Almazán et al, 2023). An example of this plot is given as follows:
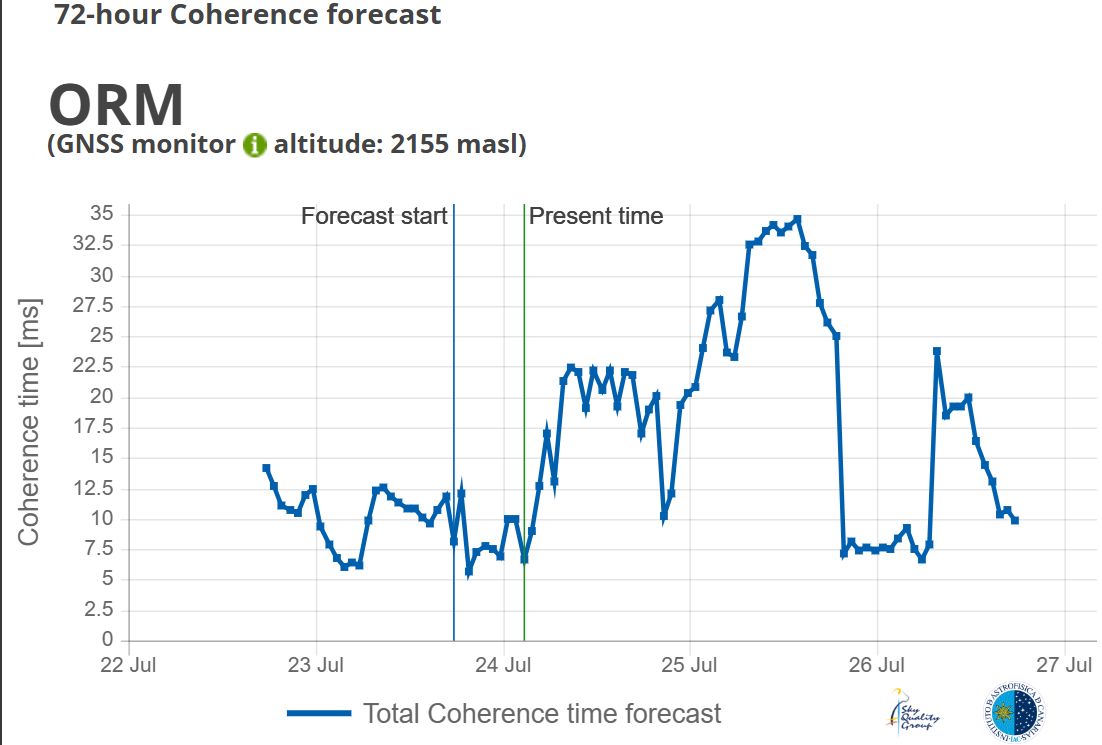
Coherence time, time series plots and statistics
Complementary to the Seeing forecasts, two more “high resolution” parameters are computed for future use in adaptive optics: the coherence time and the isoplanatic angle. The forecasted time series for the Coherence time show its predicted evolution (y-axis, in miliseconds) over time (x-axis, date and time UTC). As in the Seeing, the plot is divided by a vertical line, which indicates de latest WRF model run time (also marked in the plot with the label “Forecast Start”), into two parts:
- To the left of the line is the latest 24 hours forecast of the specific coherence parameter as predicted by the WRF model in the latest 2 runs (shown in blue color).
- To the right of the vertical line is the next 3 day (762 hours) forecast of the coherence time.
An additional vertical line in green color shows the “Present time”, which is automatically set every time the user access this plot. It helps the user to locate the present moment and its forecasted value.
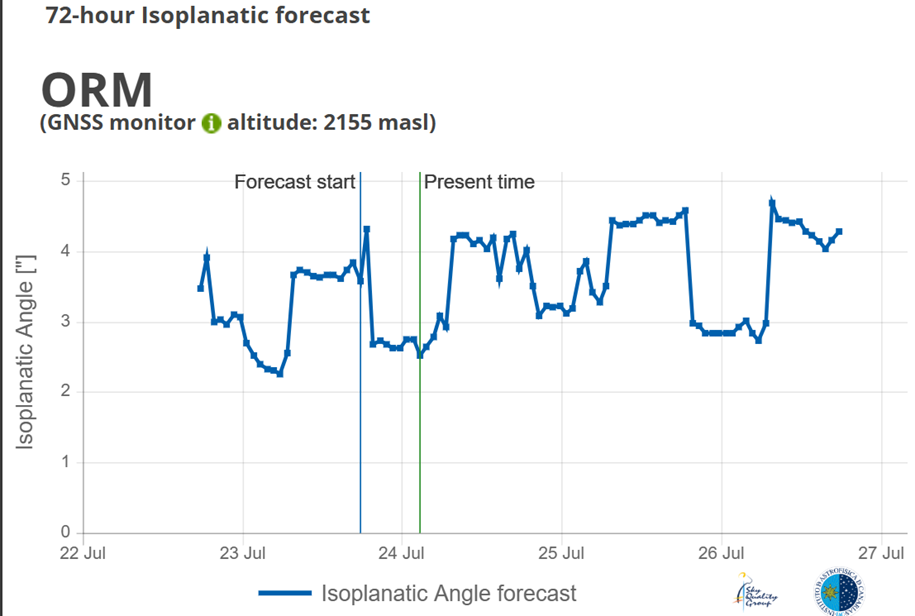
Isoplanatic angle, time series plots and statistics
The forecasted time series for the Isoplanatic Angle show its predicted evolution (y-axis, in arcseconds) over time (x-axis, date and time UTC). In each case, the plot is divided by a vertical line, which indicates de latest WRF model run time (also marked in the plot with the label “Forecast Start”, into two parts:
- To the left of the line is the latest 24 hours forecast of the specific coherence parameter as predicted by the WRF model in the latest 2 runs (shown in blue color).
- To the right of the vertical line is the next 3 day (72 hours) forecast of the isoplanatic angle.
An additional vertical line in green color shows the “Present time”, which is automatically set every time the user access this plot. It helps the user to locate the present moment and its forecasted value.
References:
Julio A Castro-Almazán, Gabriel Pérez-Jordán, Casiana Muñoz-Tuñón, Begoña García-Lorenzo. Validation of turbulence profile forecasting with WRF at the Canary Islands astronomical observatories.Preliminary results. COAT2023, Mar 2023, Durham, United Kingdom. ffhal-04604975f https://hal.science/hal-04604975v1/document
Castro-Almazán J. A., Muñoz-Tuñón C., García-Lorenzo B., Pérez-Jordán G., Varela A. M., Romero I., 2016, in Observatory Operations: Strategies, Processes, and Systems VI. p.99100P, doi:10.1117/12.2232646
G Pérez-Jordán, J A Castro-Almazán, C Muñoz-Tuñón; Precipitable water vapour forecasting: a tool for optimizing IR observations at Roque de los Muchachos Observatory, Monthly Notices of the Royal Astronomical Society, Volume 477, Issue 4, 11 July 2018, Pages 5477-5485, https://doi.org/10.1093/mnras/sty943
Pérez-Jordán G., Castro-Almazán J. A., Muñoz-Tuñón C., Codina B., Vernin J., 2015, Monthly Notices of the Royal Astronomical Society, 452, 1992
